AutoWorth: Vehicle Price and Reliability Analyzer
AutoWorth is a Java 21 application my team built to help a used-car shopper answer a practical question: is this vehicle a good deal, or is the price hiding reliability risk? The user enters the make, model, year, asking price, mileage, and an optional VIN. The app returns a predicted market price, a comparable average price, a reliability estimate, a 60,000-mile survival probability, and a plain-language recommendation.
The Industrial Engineering context is reliability and decision support. Instead of only comparing prices, the system combines market data with Weibull reliability parameters, so the final recommendation considers both cost and expected life remaining.
Team
| Name | ePortfolio |
|---|---|
| Me | Current page |
| Jose Romero | Jose Romero ePortfolio |
| Zack Dean | Zack Dean ePortfolio |
Project Summary
Our final Computing II project was a vehicle analysis system built with Java, Spring Boot, and Vaadin. The app reads a CSV dataset of vehicle listings and reliability fields, trains a SMILE Random Forest model to predict price, and uses Weibull beta and eta values to estimate mean time to failure (MTTF). The intended purpose was to make car-buying data easier to act on by turning raw numbers into a simple recommendation.
The dataset included fields such as manufacturer, model, price, odometer, year, vehicle type, generation labels, listing count, model rank, and Weibull reliability parameters. We also added an optional NHTSA VIN decoder so the app could use extra vehicle details when the VIN was available.
Important skills I practiced included creating custom Java classes, separating responsibilities across packages, working with ArrayList, HashSet, HashMap, records, file input/output, SMILE data frames, Vaadin form components, and reliability calculations.
Development Process
Our original goal was to create a car-buying helper that could compare a user’s listing against similar vehicles. As the project developed, the scope became more interesting: we did not want the output to stop at “above average” or “below average.” We wanted the program to combine price and reliability so a user could understand whether a lower price was actually worth the mileage risk.
The Vaadin web interface was part of the plan from the start, but the internal design still had to evolve as we built it. We kept the analysis logic in the VehicleHandling package so the price and reliability engine stayed separate from the UI. That made the project easier to test and reason about because the Vaadin view could focus on user input and results while the analyzer handled the actual calculations.
One major roadblock was matching user input to messy model names in the dataset. A car model could appear with trims like le, xle, sport, limited, or drivetrain labels. We solved this by normalizing display models after loading the CSV and using a HashSet of trim tokens to avoid cluttered dropdowns.
Another roadblock was file loading. The CSV needed to work consistently no matter where the program was started from, so I worked on CsvInputResolver to avoid hardcoding one file path in multiple classes.
The final project matched the spirit of our original idea, but it became more complete than I expected. It grew from a comparison calculator into a decision-support tool that includes price prediction, reliability math, VIN enrichment, and an actual user interface.
Key Features
Guided vehicle inputs
The form guides the user through make, model, year, price, mileage, and optional VIN. The goal was to make the analysis feel approachable instead of making the user think about the dataset directly.
Filtered dropdowns
The make, model, and year fields are connected to the data, so the user can choose from available vehicles instead of typing every value manually.
Readable results
The app presents the predicted price, market average, reliability outlook, survival chance, and decision guidance as separate result cards.
Startup Screen
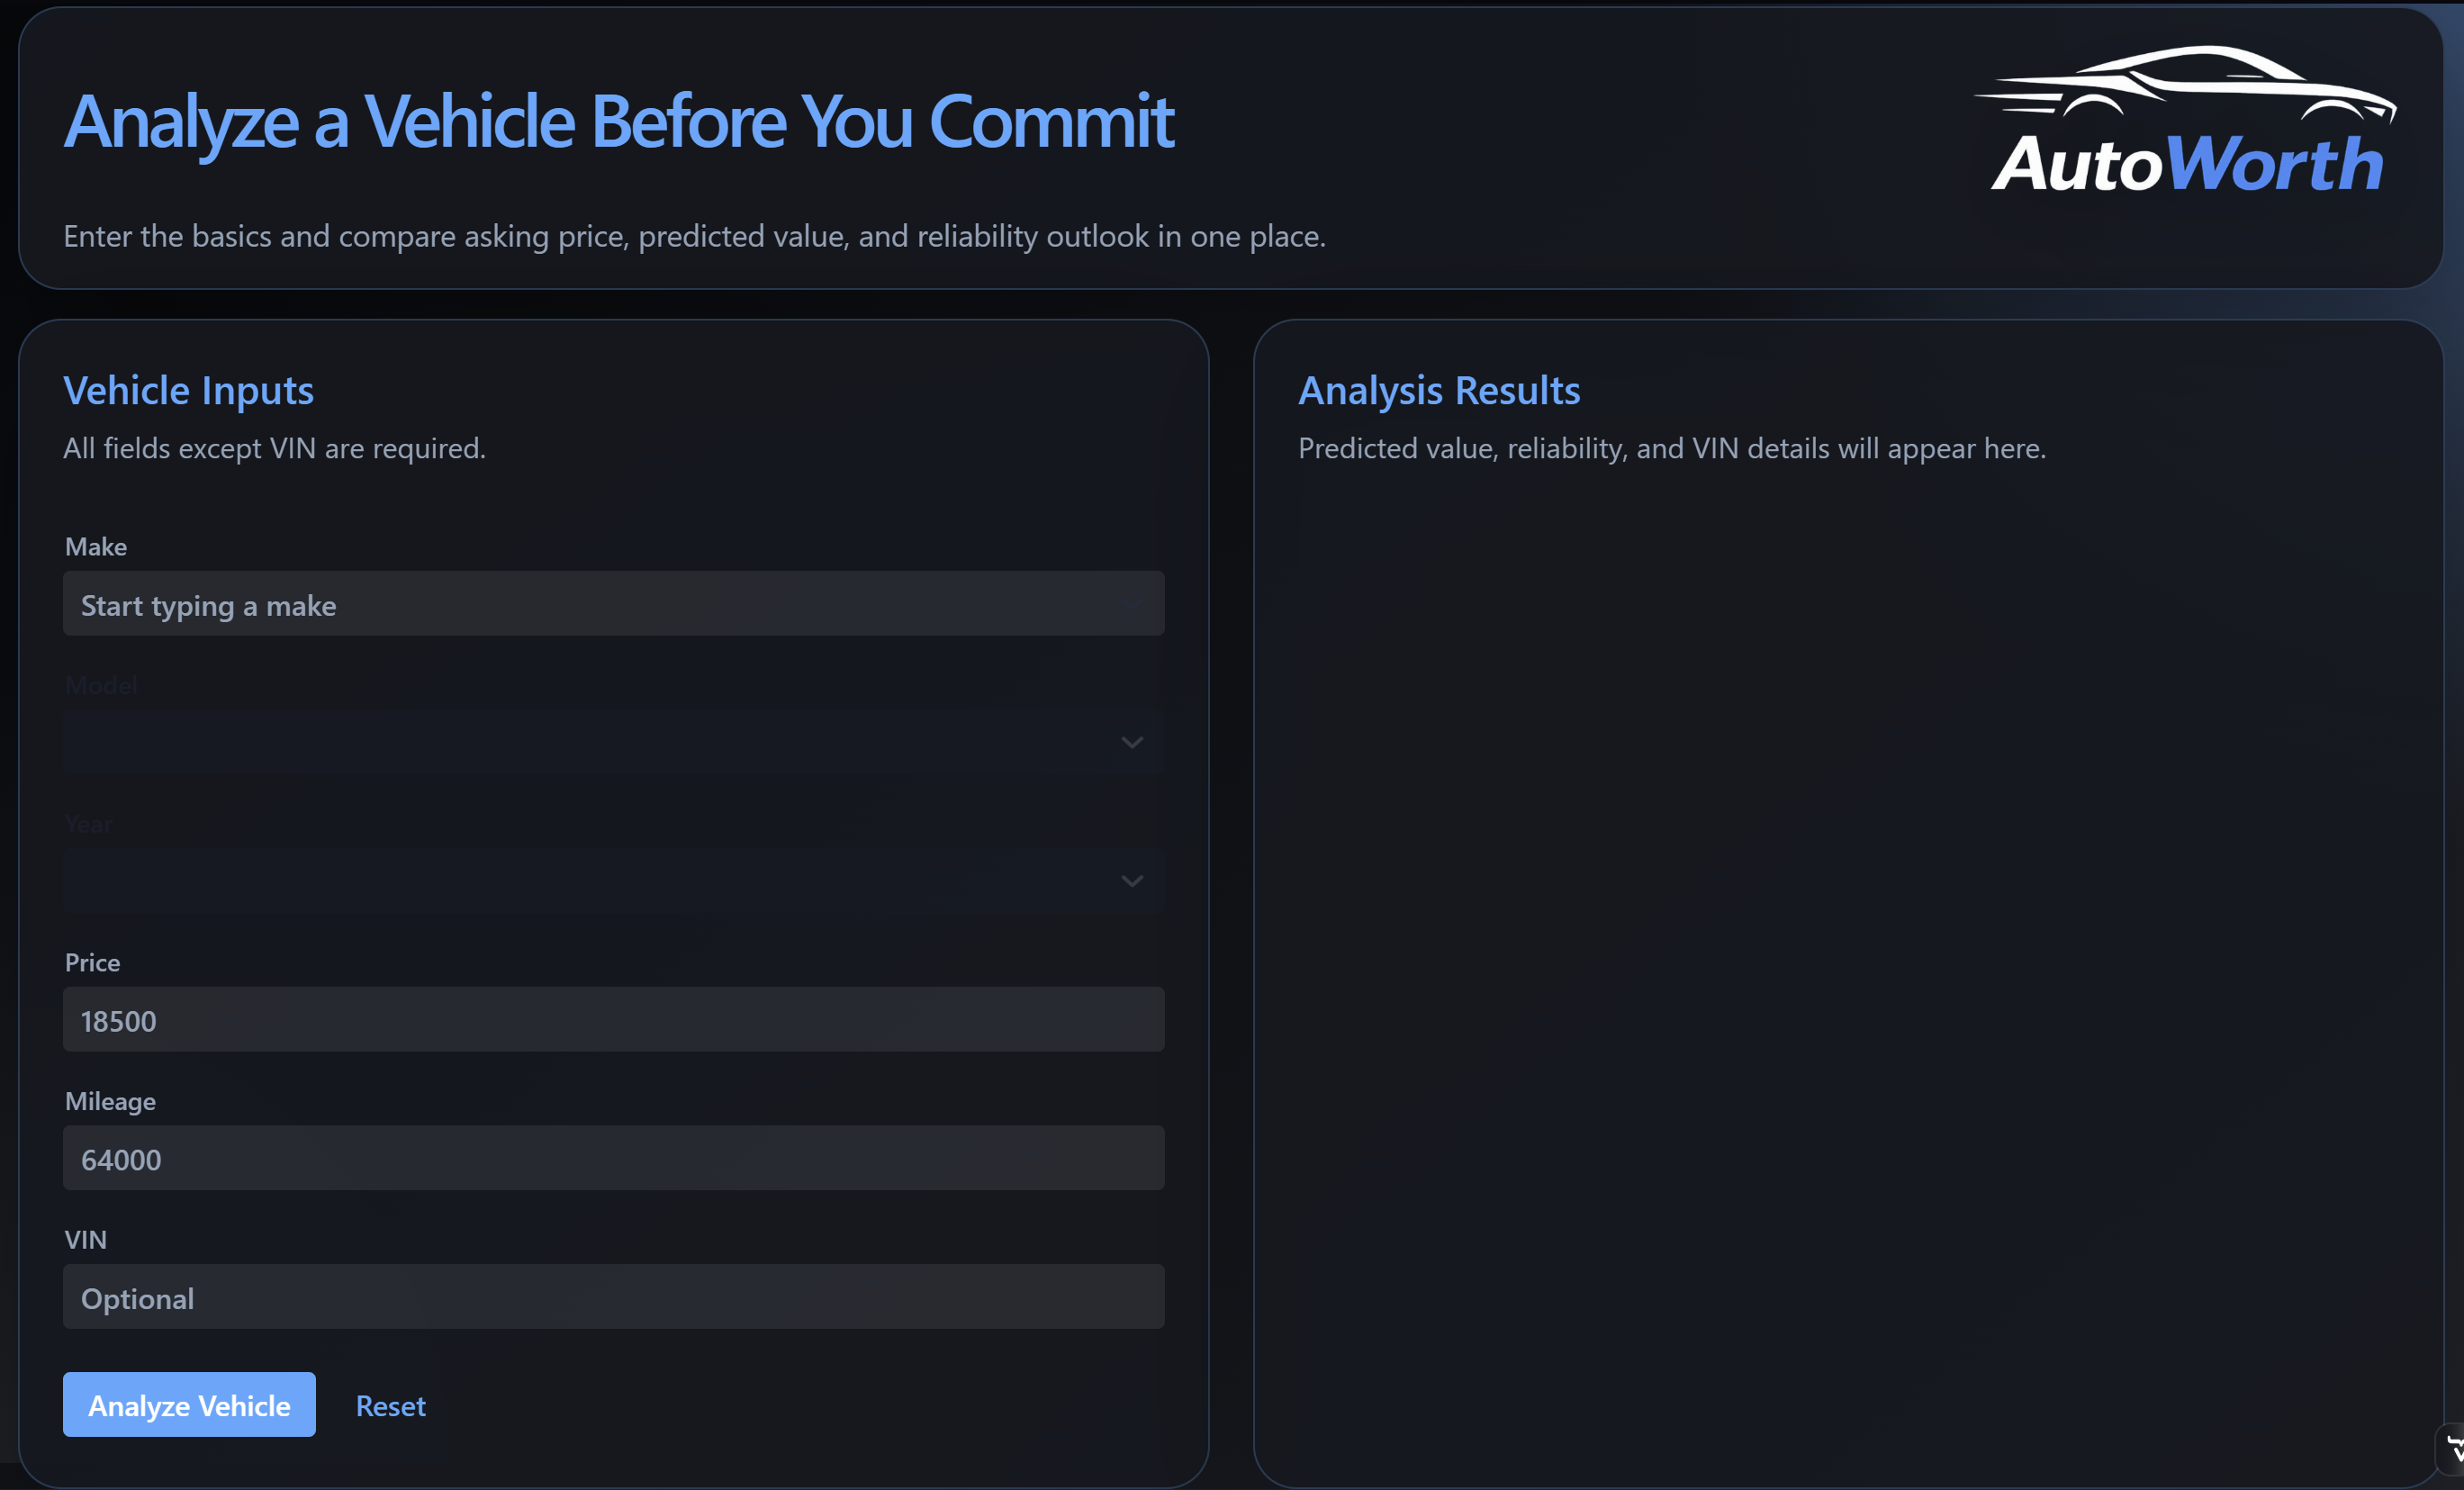
The startup screen shows the main workflow in one place. The left side collects the vehicle information, while the right side is reserved for analysis results. This layout makes the purpose of the app clear before the user even runs a search.
Dropdown Selection
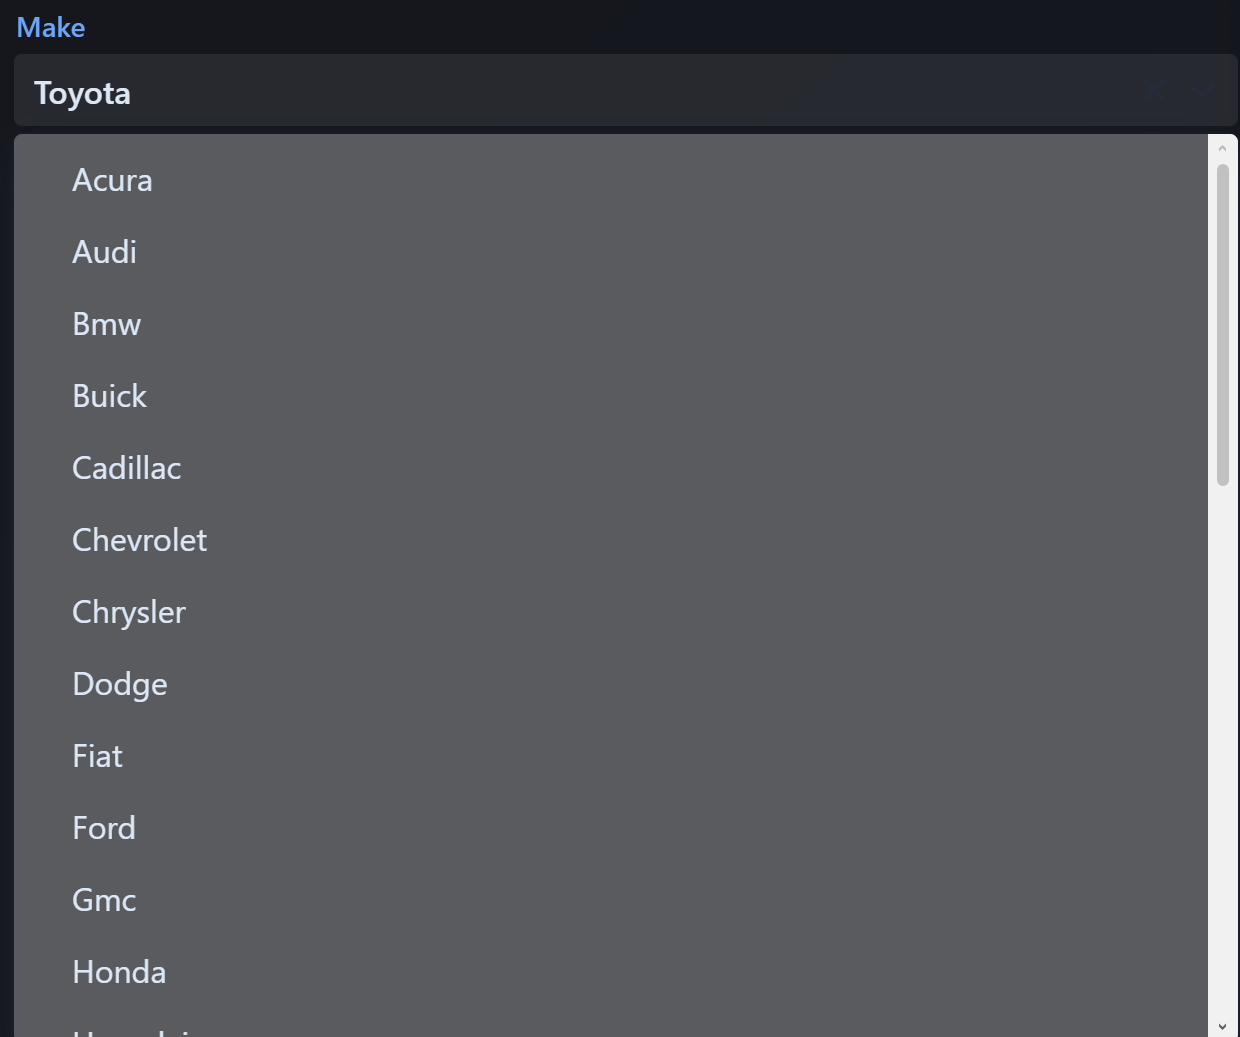
The make dropdown is tied to the dataset so users can start with an available manufacturer instead of typing a value that may not match the file. This mattered because the analyzer depends on matching the user’s selection to vehicle records.
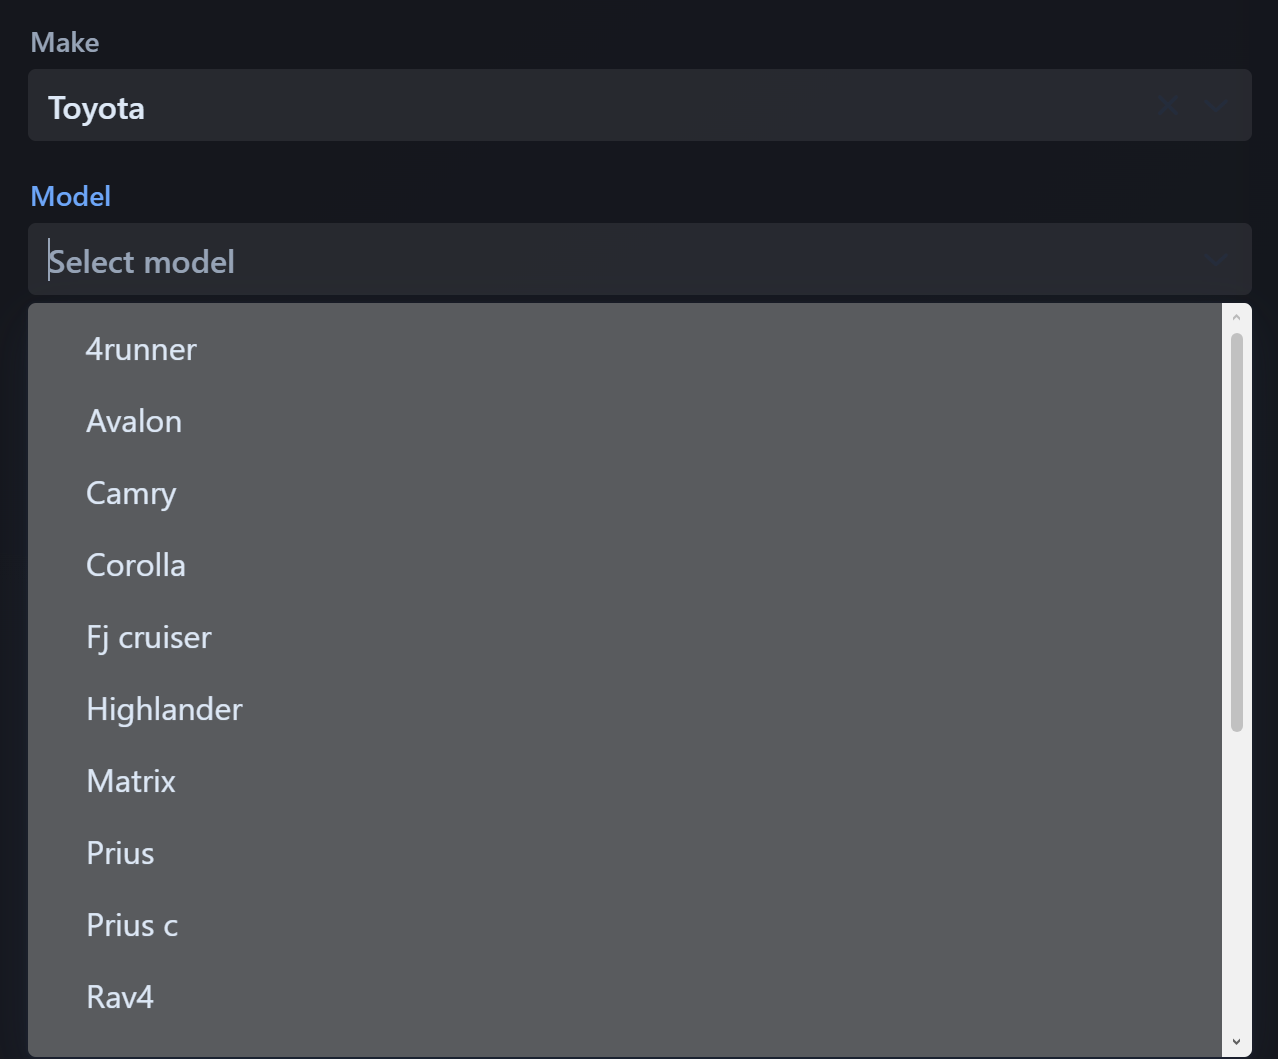
After a make is selected, the model list updates to show matching models. This is where the model-cleaning work becomes visible to the user because trims and inconsistent dataset names are reduced into a more understandable list.
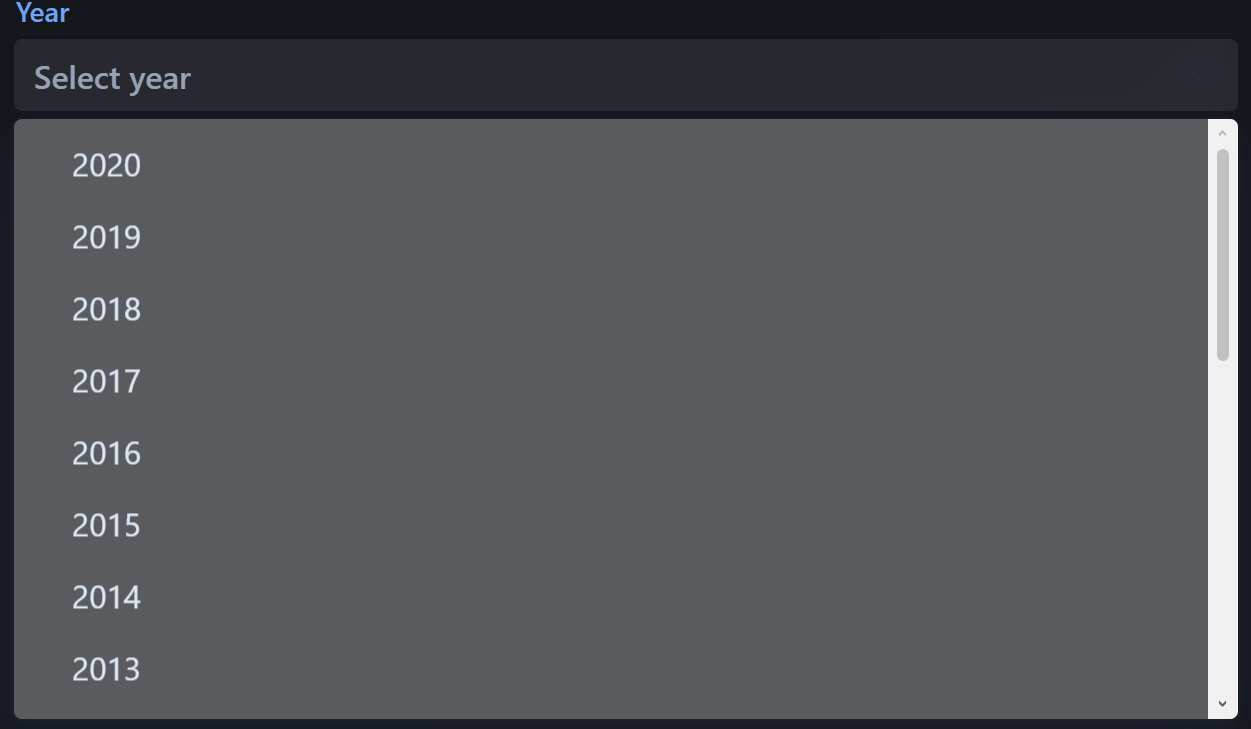
The year dropdown narrows the choices one step further. This keeps the user inside the actual dataset and helps the analysis compare the listing to the closest available vehicle records.
Analysis Results
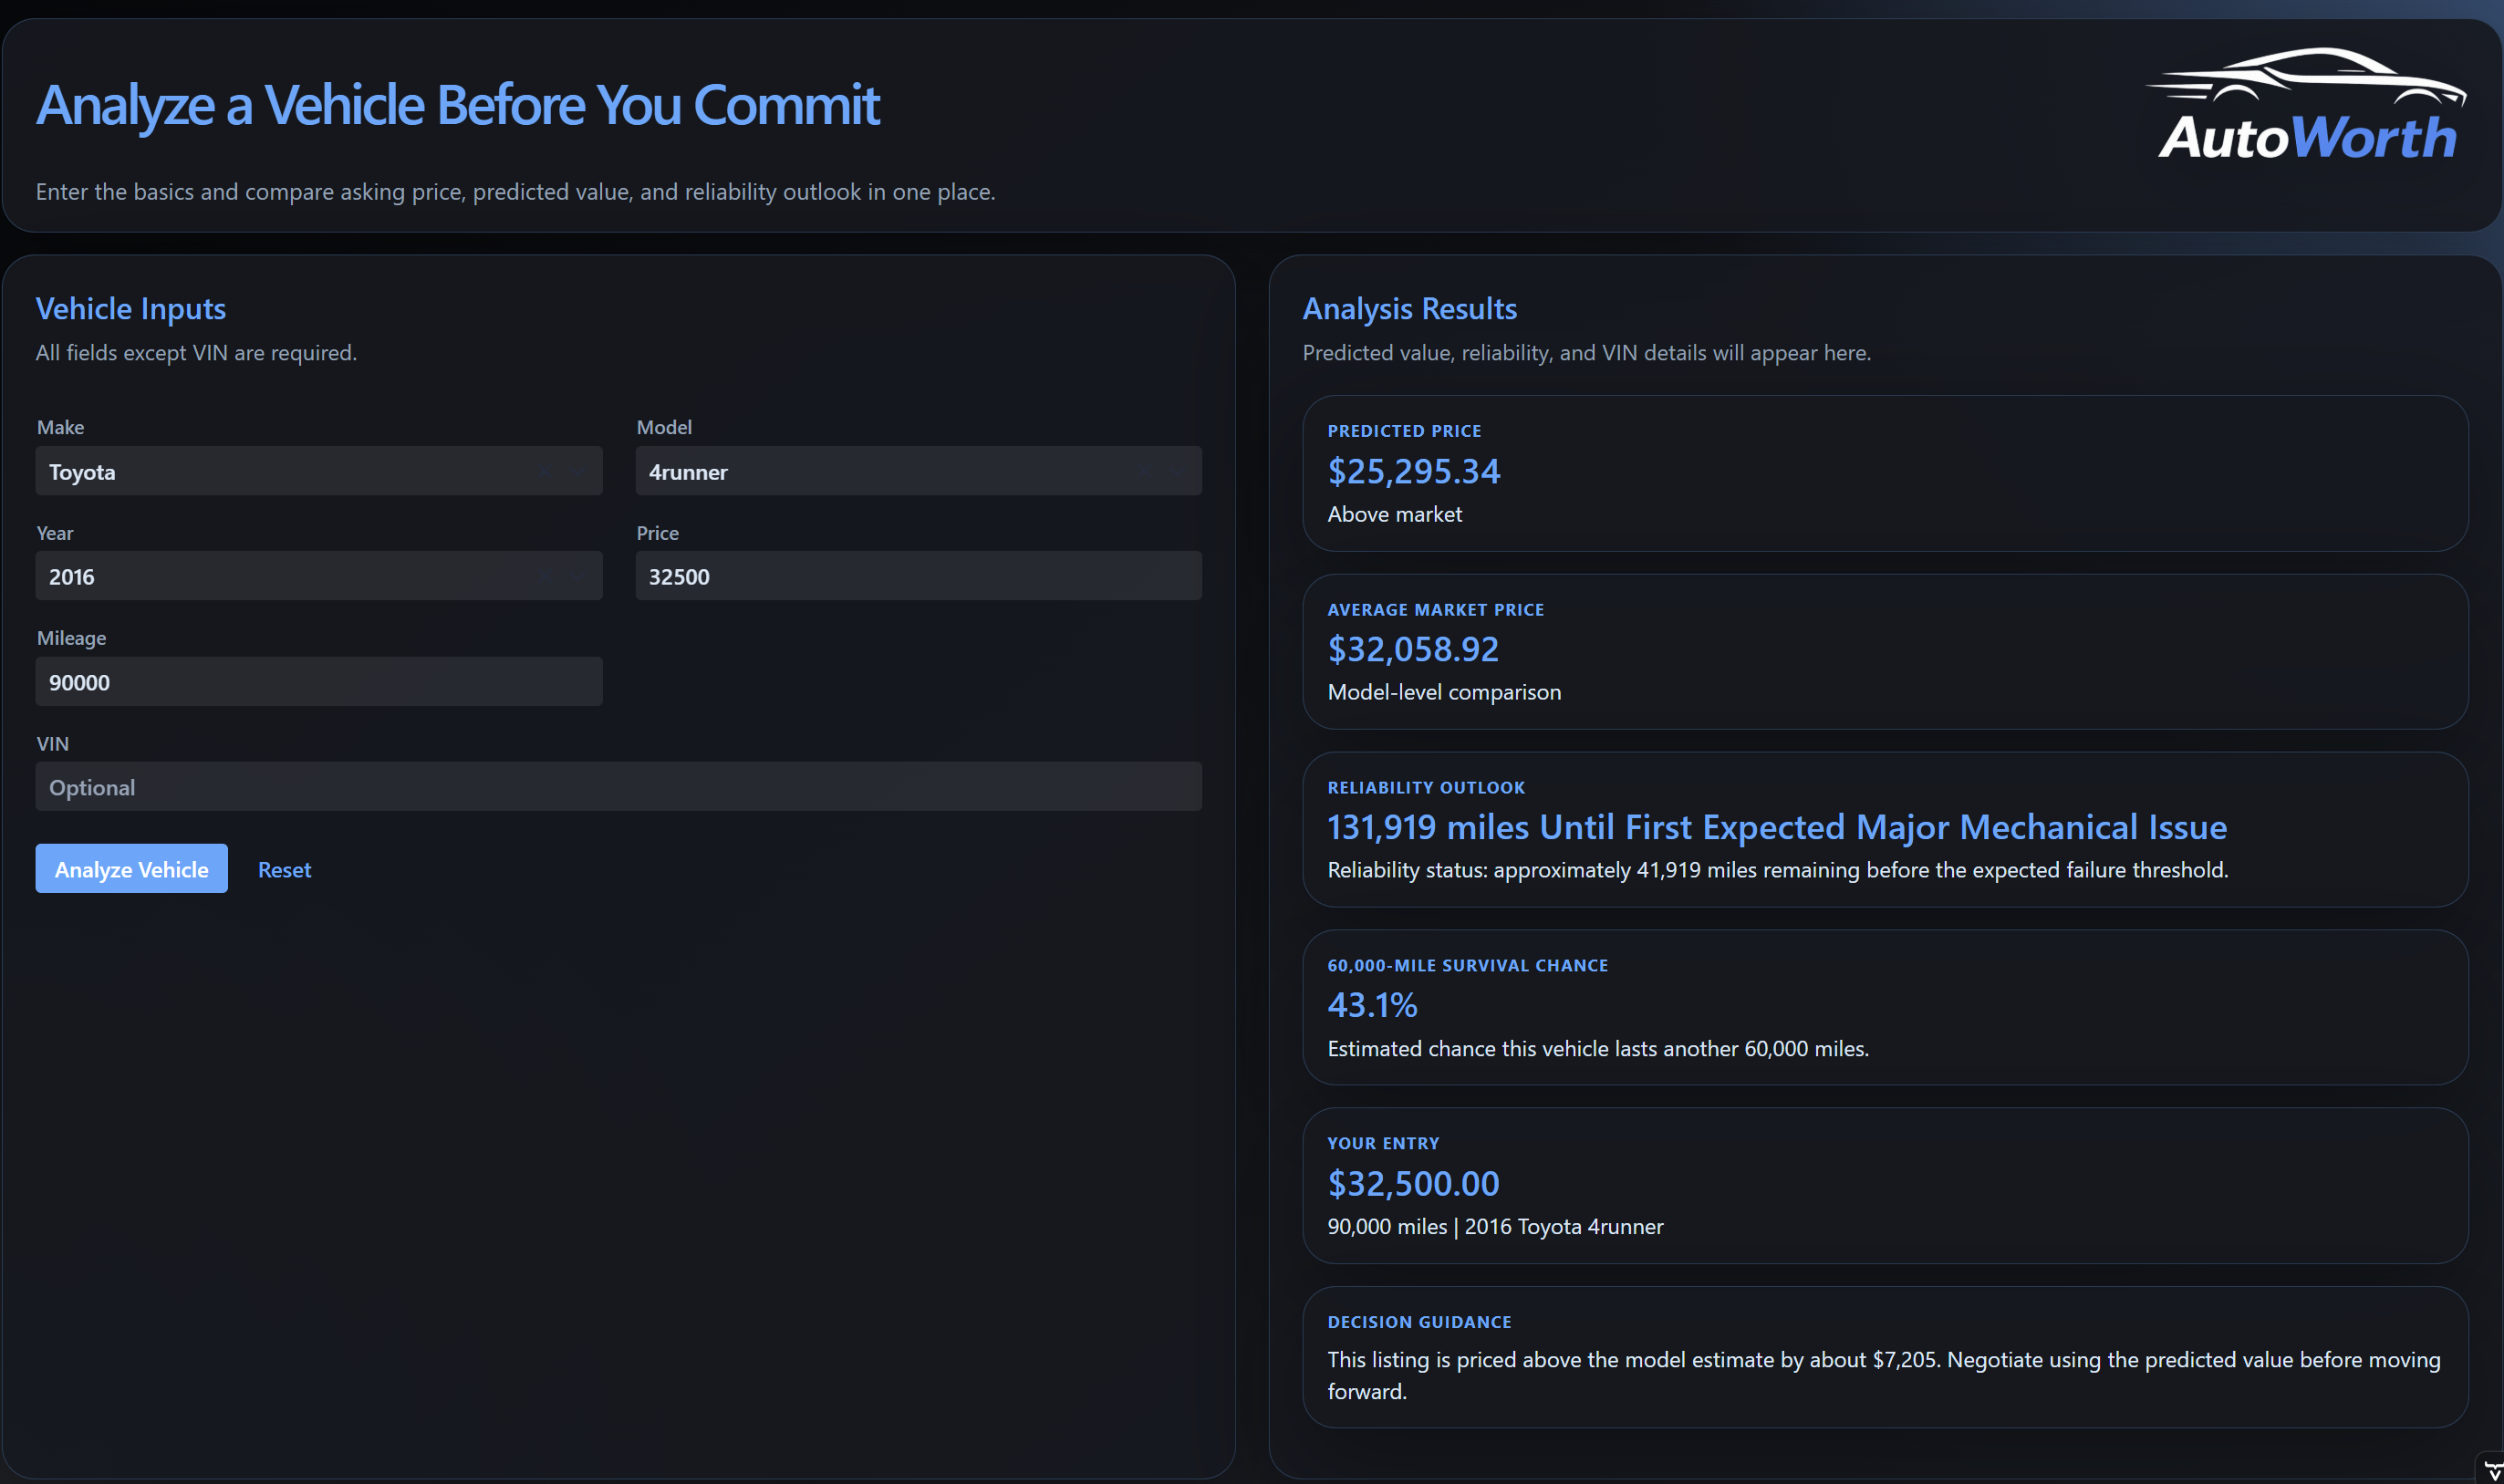
The results view is the most important part of the project because it turns the technical work into something readable. Instead of showing only raw calculations, AutoWorth separates the predicted price, average market price, reliability outlook, 60,000-mile survival chance, and final decision guidance. This helps the user compare price and reliability together before deciding whether the listing is worth considering.
Reflection
This project made object-oriented design feel much more practical to me. Before this, separating classes sometimes felt like something we did because the assignment expected it. In AutoWorth, the separation had a real purpose: the UI, service layer, file resolver, price model, VIN decoder, and analysis engine each had different reasons to exist.
I am most proud of the work I did around the analysis side: making CSV loading more reliable, helping train and use the price model, and shaping the analyzer so it could turn messy vehicle data into a clear result. I also learned how much debugging is really about narrowing uncertainty. When the app gave a strange result, we had to ask whether the issue came from the file path, the CSV row parsing, the model encoding, the matching logic, or the reliability calculation.
As a teammate, I grew by learning how to write code that other people could plug into. CsvInputResolver is a good example: it is small, but it removed duplicated logic and made two other classes easier to maintain. I also learned that a lot of programming happens before writing a line of code. While working on the vehicle analyzer and service logic, I used Oracle’s Java documentation to research which classes and methods were already available, what problems they were designed to solve, and how I could build my own logic around them. That changed how I approached the project because VehicleAnalyzer depended on choosing the right tools for reading files, storing matches, filtering records, sorting results, and returning clean analysis data. It made me feel more like I was thinking as a programmer: not trying to invent everything from scratch, but learning how to use the Java library as part of my design process.
At the start of the project, I was less confident about combining Java classes, external libraries, and a user interface into one working system. By the end, I felt much more comfortable building a program with multiple layers, tracing data through those layers, and using Industrial Engineering ideas like reliability analysis in a software project.